A Tableau-driven exploration of 24 years of US presidential election data, uncovering voting patterns across 7 elections, identifying high-risk "swing" states most likely to flip, and forecasting which party is most likely to win the next election based on historical sentiment trends.
Across seven presidential elections from 2000 to 2024, both major parties have won an equal number of times — but the path to victory has shifted dramatically. In 2016, Hillary Clinton won the popular vote but lost the electoral college. This analysis maps where party strongholds remain stable, which states swing most often, and what sentiment trends in those high-risk states suggest for the next election.
The data tells a consistent story: while Republicans dominate the electoral map by area, Democrats hold structurally safer electoral college positions. The next election hinges on three swing states.
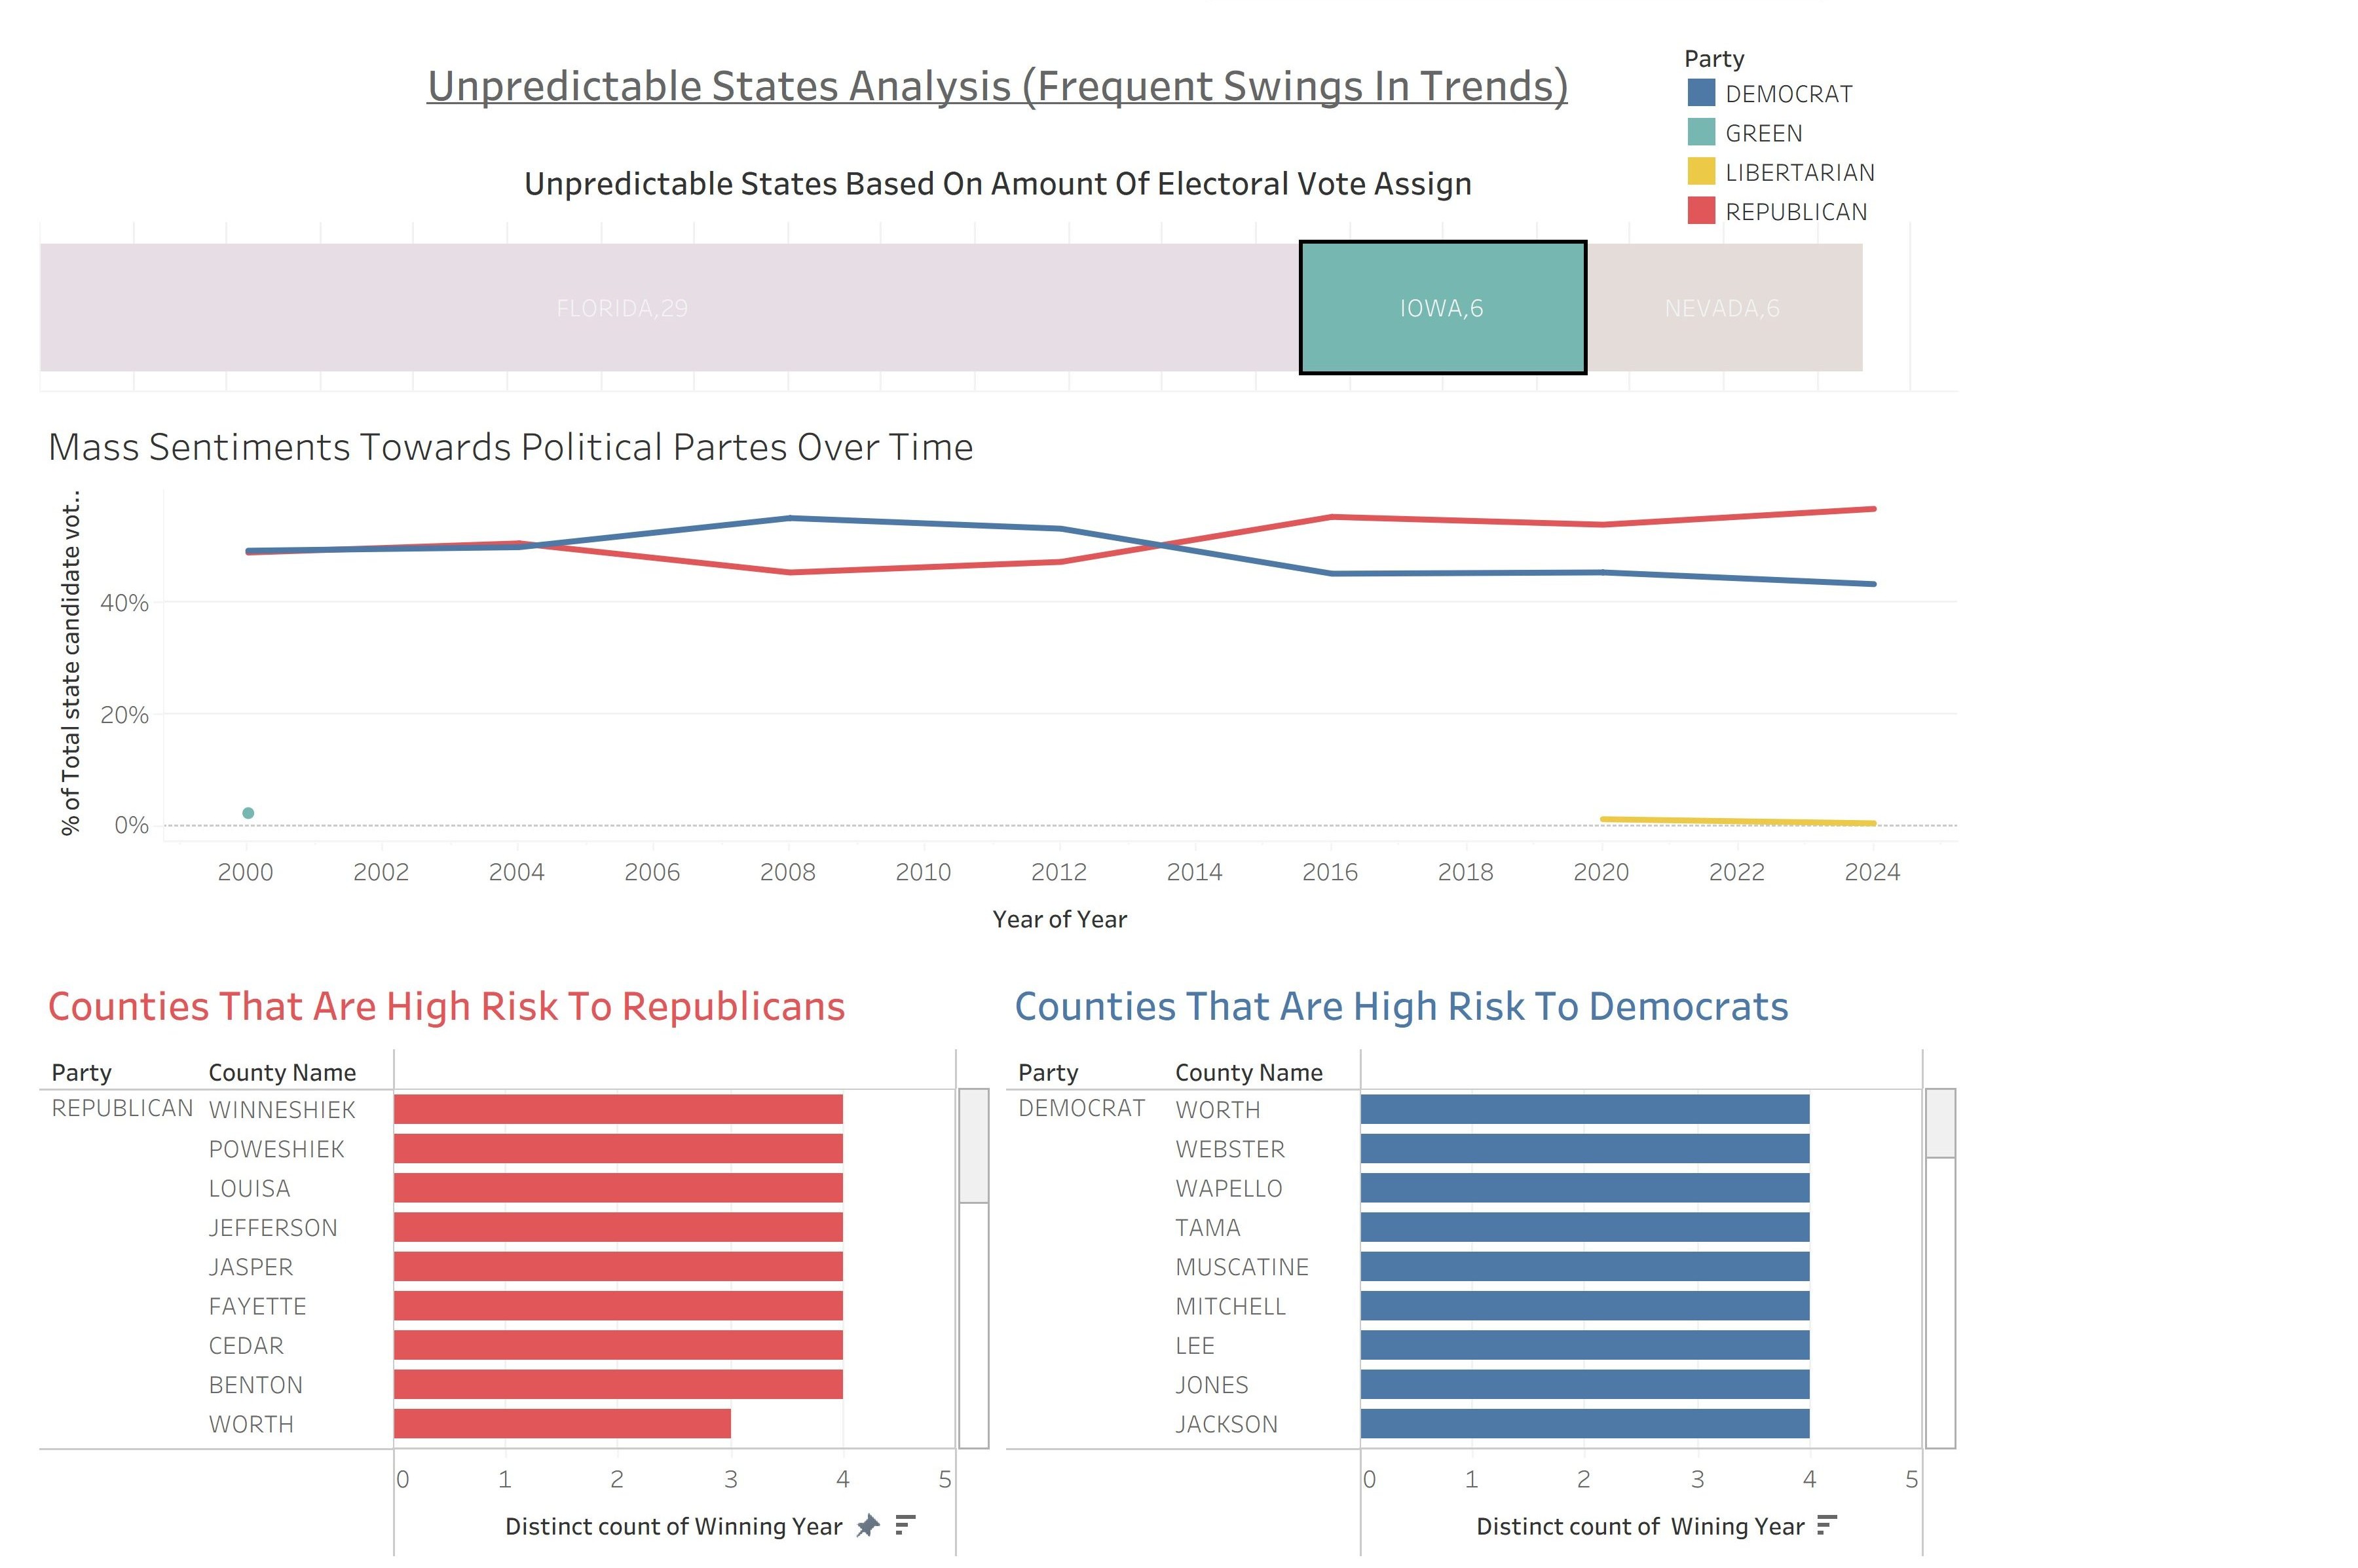
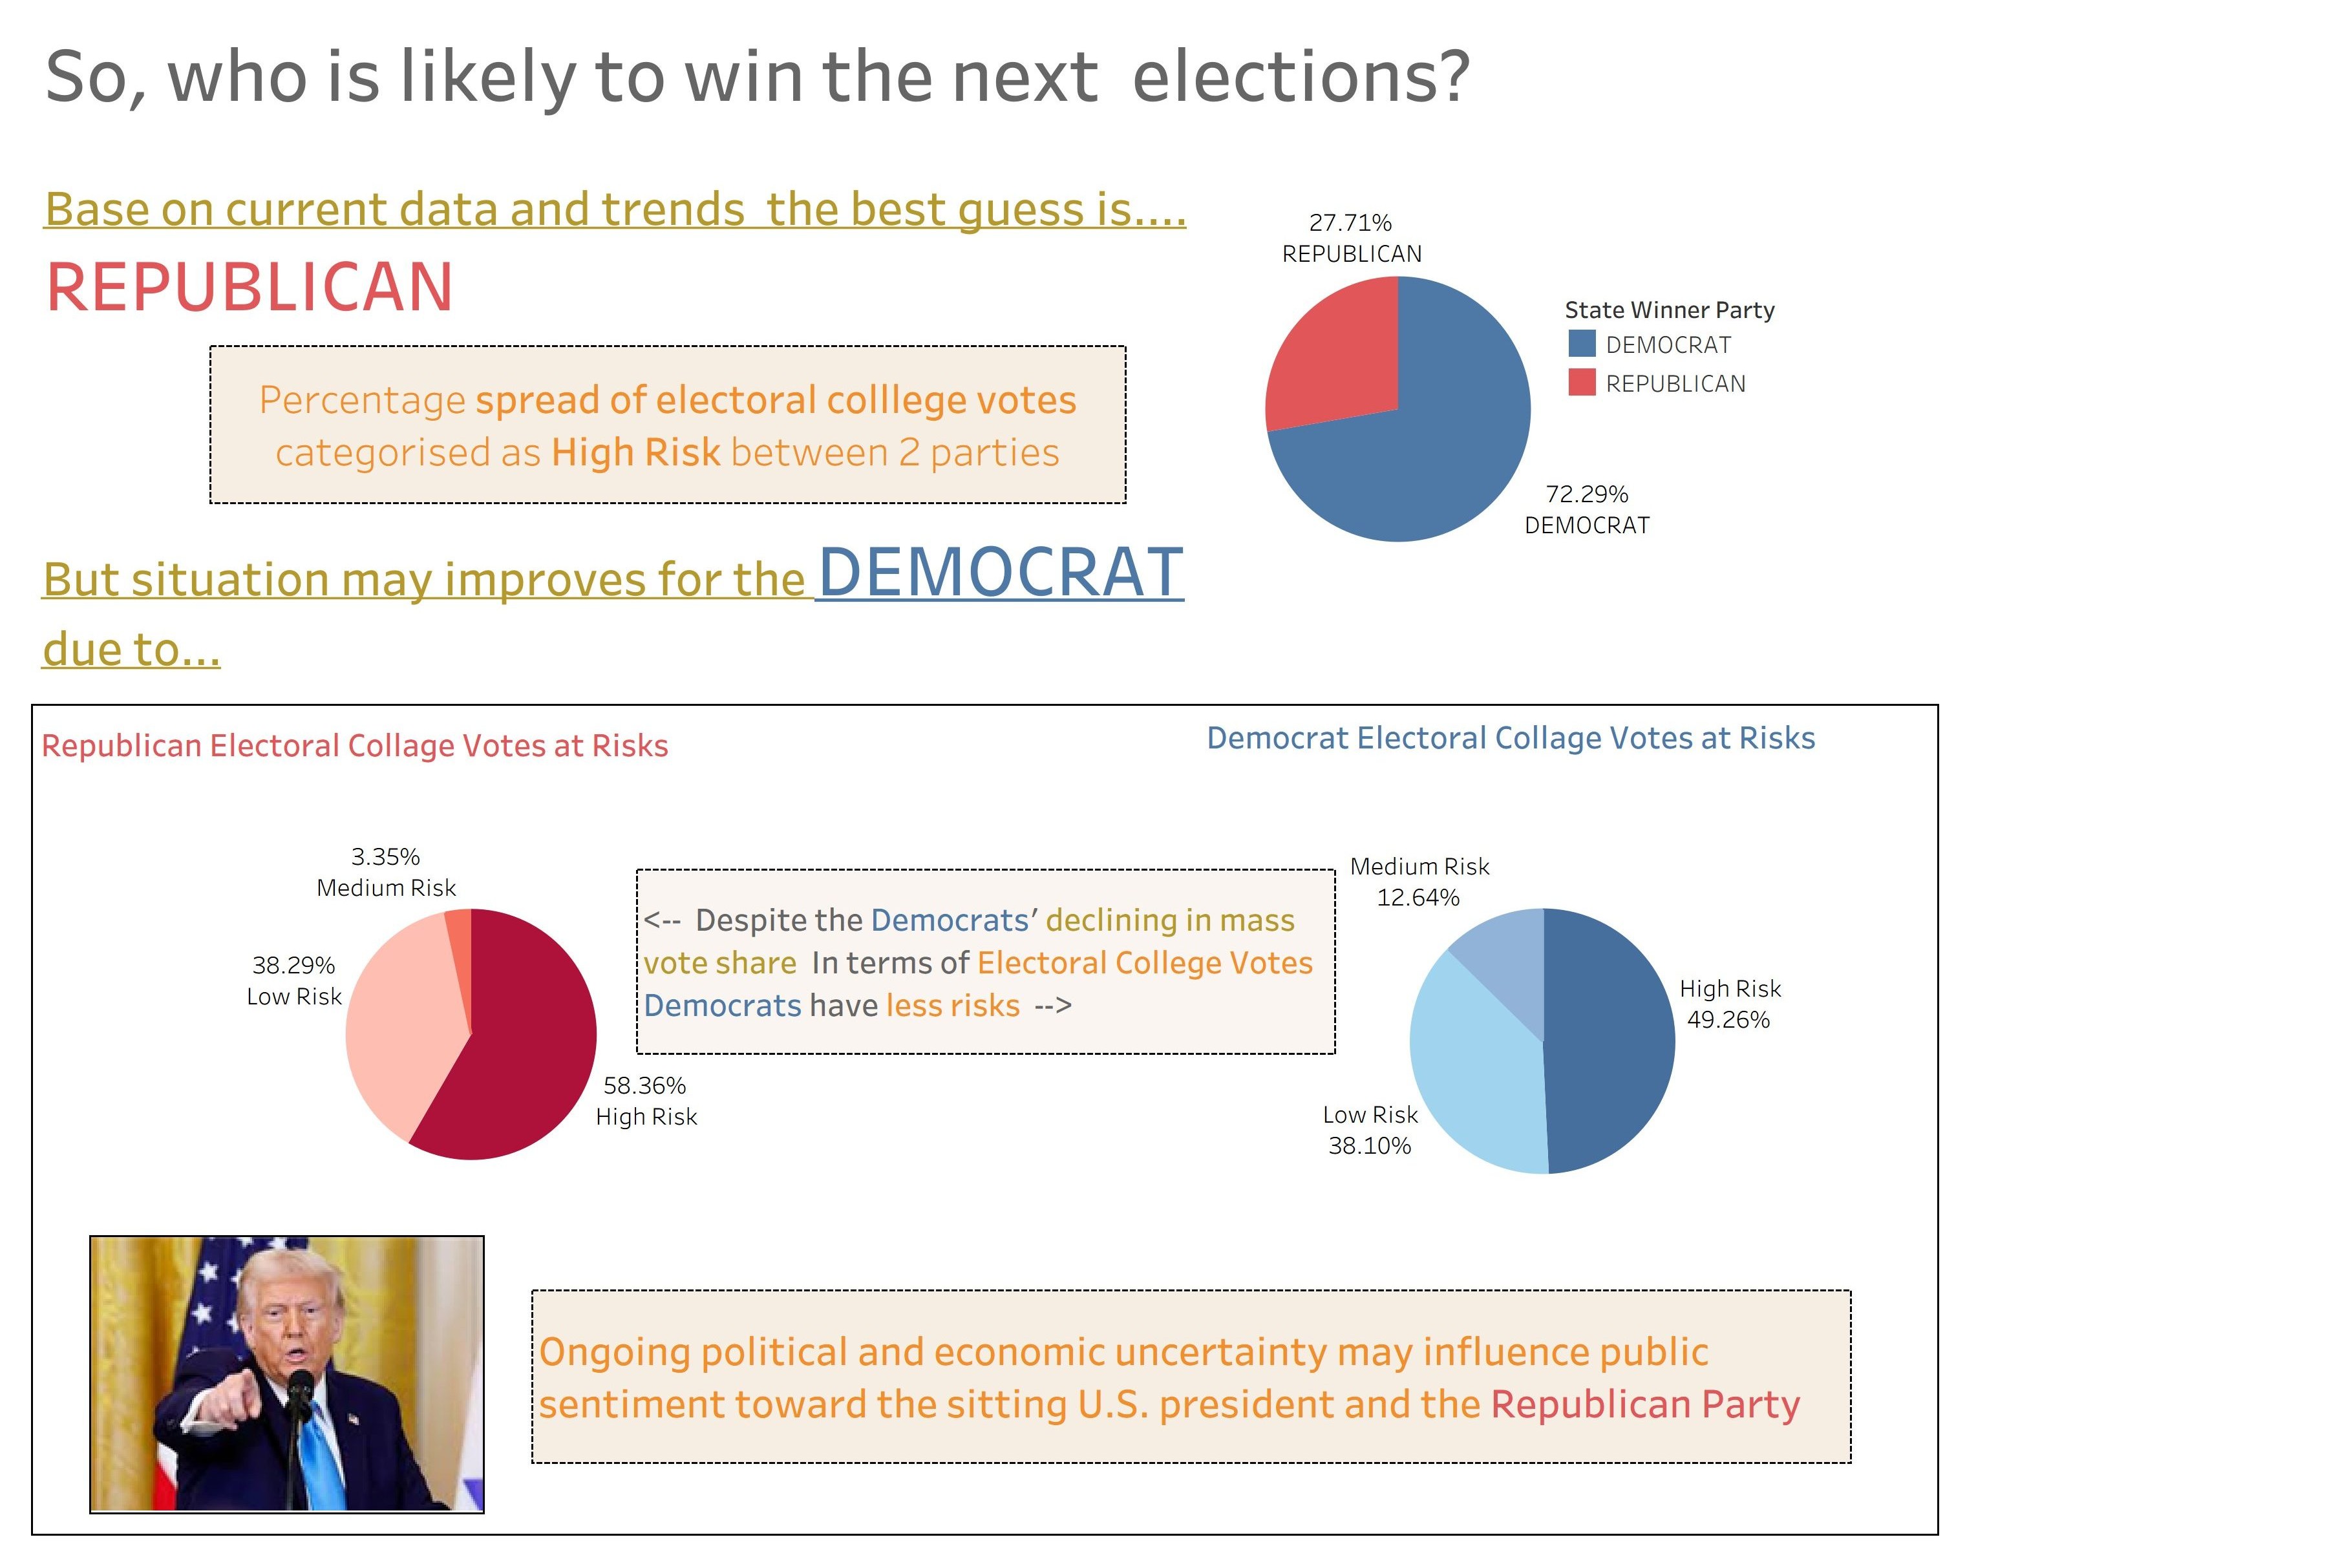
Six interactive Tableau dashboards walking through the data — from popularity rankings to swing-state analysis to a final prediction for the next election. Click any slide to view it full-size; commentary for each appears below as you swipe.
The complete Tableau workbook with all dashboards, calculated fields, and the cleaned electoral college dataset — hosted on GitHub.
Browse the Tableau workbook, source CSV data, and project files for full reproducibility.